[MATLAB 영상처리 기초 7] 이미지의 화질개선 Contrast-Brightness-Gamma - part1
앞서 [MATLAB 영상처리 기초 4] 이미지의 픽셀값 다루기 - Crop, 선형연산 에서 보았듯이,
픽셀값을 증가시키면 이미지의 밝기가 밝아짐을 알 수 있습니다.
img_gray_crop_UP = img_gray_crop .* 1.7; % intensity 70% UP

단순히 픽셀값을 증가시킨다면 이미지의 Global 픽셀값들이 증가하므로 원하지 않는 결과를 얻을 수
있습니다. 예를들어 ROI (region of interest) 의 픽셀값 분포가 높거나 낮은 intensity에 집중분포해 있다면
이 영역만을 확장시켜 주어 밝기나 컨트래스트를 개선할 수 있지만, 전 영역의 픽셀값을 증가시키면 그저
빛바랜 듯한 이미지 결과가 나오기도 합니다.
MATLAB의 imadjust( ) 함수는 이미지의 brightness와 contrast 를 변환하는 역할을 하며 syntax는
다음과 같습니다.
% J = imadjust(I,[low_in high_in],[low_out high_out],gamma)
입력 파라메터로는,
1) I: 입력 이미지
2) [low_in high_in], [low_out high_out]: low_in 과 high_in 사이의 픽셀값을 low_out 과 high_out
사이의 값으로 매핑 합니다. 즉 이미지의 픽셀값 중 low_in 보다 작은값은 low_out 으로
매핑하고, high_in 보다 큰 값은 high_out 으로 매핑 한다는 뜻입니다.
3) gamma: 입력 이미지를 매핑하는 곡선의 모양을 정의.
이미지 픽셀값 변환에서 Brightness와 contrast 는 뗄수 없는 관계이고, 항상 선형적인 상관관계를
갖지도 않습니다. 이를 염두해 두고 위의 imadjust( ) 입력 파라메터에 대한 설명을 첨가 하자면,
high_in = high_out , low_in < low_out 경우 brightness는 증가하지만 contrast는 감소하는 반면
low_in = low_out, high_in < hight_out 경우 brightness는 증가하고 contrast 또한 증가 합니다.
[low_out high_out] 등의 입력 파라메타 값들은 0과 1의 범위를 가지며, 만일 입력 이미지가 uint8 등의
형식을 갖는다면 자동으로 255 (= uint8 의 최대값) 을 곱해서 연산에 적용 됩니다.
마지막 입력 파라메타인 Gamma 의 기본값은 1이고, 만일 1보다 작으면 낮은 픽셀값 영역의 contrast가
증가하여 brightness 또한 증가하는 반면 높은 픽셀값 영역의 contrast가 감소 합니다.
다음은 Brightness-Contrast-Gamma의 관계를 보여주는 그래프이며 이해를 돕는 설명들이 출처 1 에
담겨있으므로 한번쯤 읽어 보시길 바랍니다. 간략히 설명하자면 입력 gray level 과 출력 gray level의
매핑을 보여주는 그래프들로써 빨간색 선의 증감에 따라 brightness 가 밝아지거나 어두어짐을 나타내고
빨간색 선의 기울기에 따라 contrast의 증감을 보여줍니다. Gamma의 첫번째와 두번째 그래프와 같이
빨간색 선이 어두운 영역에서 급격히 증가하면 (gamma < 1) 어두운 영역의 픽셀 분포가 확장되어
이 영역의 가시성(visible)이 좋아지는 효과가 있습니다.

이제는 imadjust( ) 명령어를 이용하여 이미지의 brightness를 변환해 보겠습니다. 입력 이미지는
다음과 같고 gray scale 이미지로 변환하여 이용할 것입니다.
밑의 이미지는 본 블로그 맨밑 출처 2에 가셔서 다운로드 받을 수 있습니다.

다음은 brightness 변환의 결과를 보여줍니다. imadjust( ) 의 입력 파라메터인 [low_in high_in]
[low_out high_out] 그리고 gamma 의 값들을 변화시켜 주면서 얻은 결과들 입니다.
각 변환결과의 설정은 밑의 코드와 같습니다. 여기서 'min_px'와 'max_px' 는 각각 이미지의
최소, 최대 픽셀값을 나타냅니다.
img = imread('NCI-jdfn7Z03Qa4.jpg');
img_gray = rgb2gray(img);               % convert from RGB to grayscale image data
img_gray = im2double(img_gray);         % convert from uint8 to double type data

min_px = min(img_gray(:));
max_px = max(img_gray(:));

% increase brightness by three methods
gamma = 1;
raise_low_out = imadjust(img_gray,[0 1],[min_px+0.2 1],gamma);   % raise 'low_out'
raise_high_out = imadjust(img_gray,[0 max_px],[0 1],gamma);      % raise 'high_out'

gamma = 0.8;
low_gamma = imadjust(img_gray,[0 1],[0 1],gamma);                % low 'gamma'

% plot results
figure; montage({img_gray,raise_low_out})
figure; montage({img_gray,raise_high_out})
figure; montage({img_gray,low_gamma})


위의 변환결과를 보다시피 우측의 이미지들은 더 밝은 intensity를 갖음을 알 수 있습니다.
다음으로 각 변환결과들의 histogram 또한 보겠습니다.

첫번째 [low_in, high_in] = [0, 1], [low_out high_out] = [min_px+0.2, 1] 경우는
전제적인 histogram의 모양은 유지한채 픽셀의 최소값이 0.2 이상으로 이동했음을 알 수 있습니다.

두번째 [low_in, high_in] = [0, max_px], [low_out high_out] = [0, 1] 경우는
histogram이 전반적으로 우측으로 확장되었음을 볼 수 있습니다.
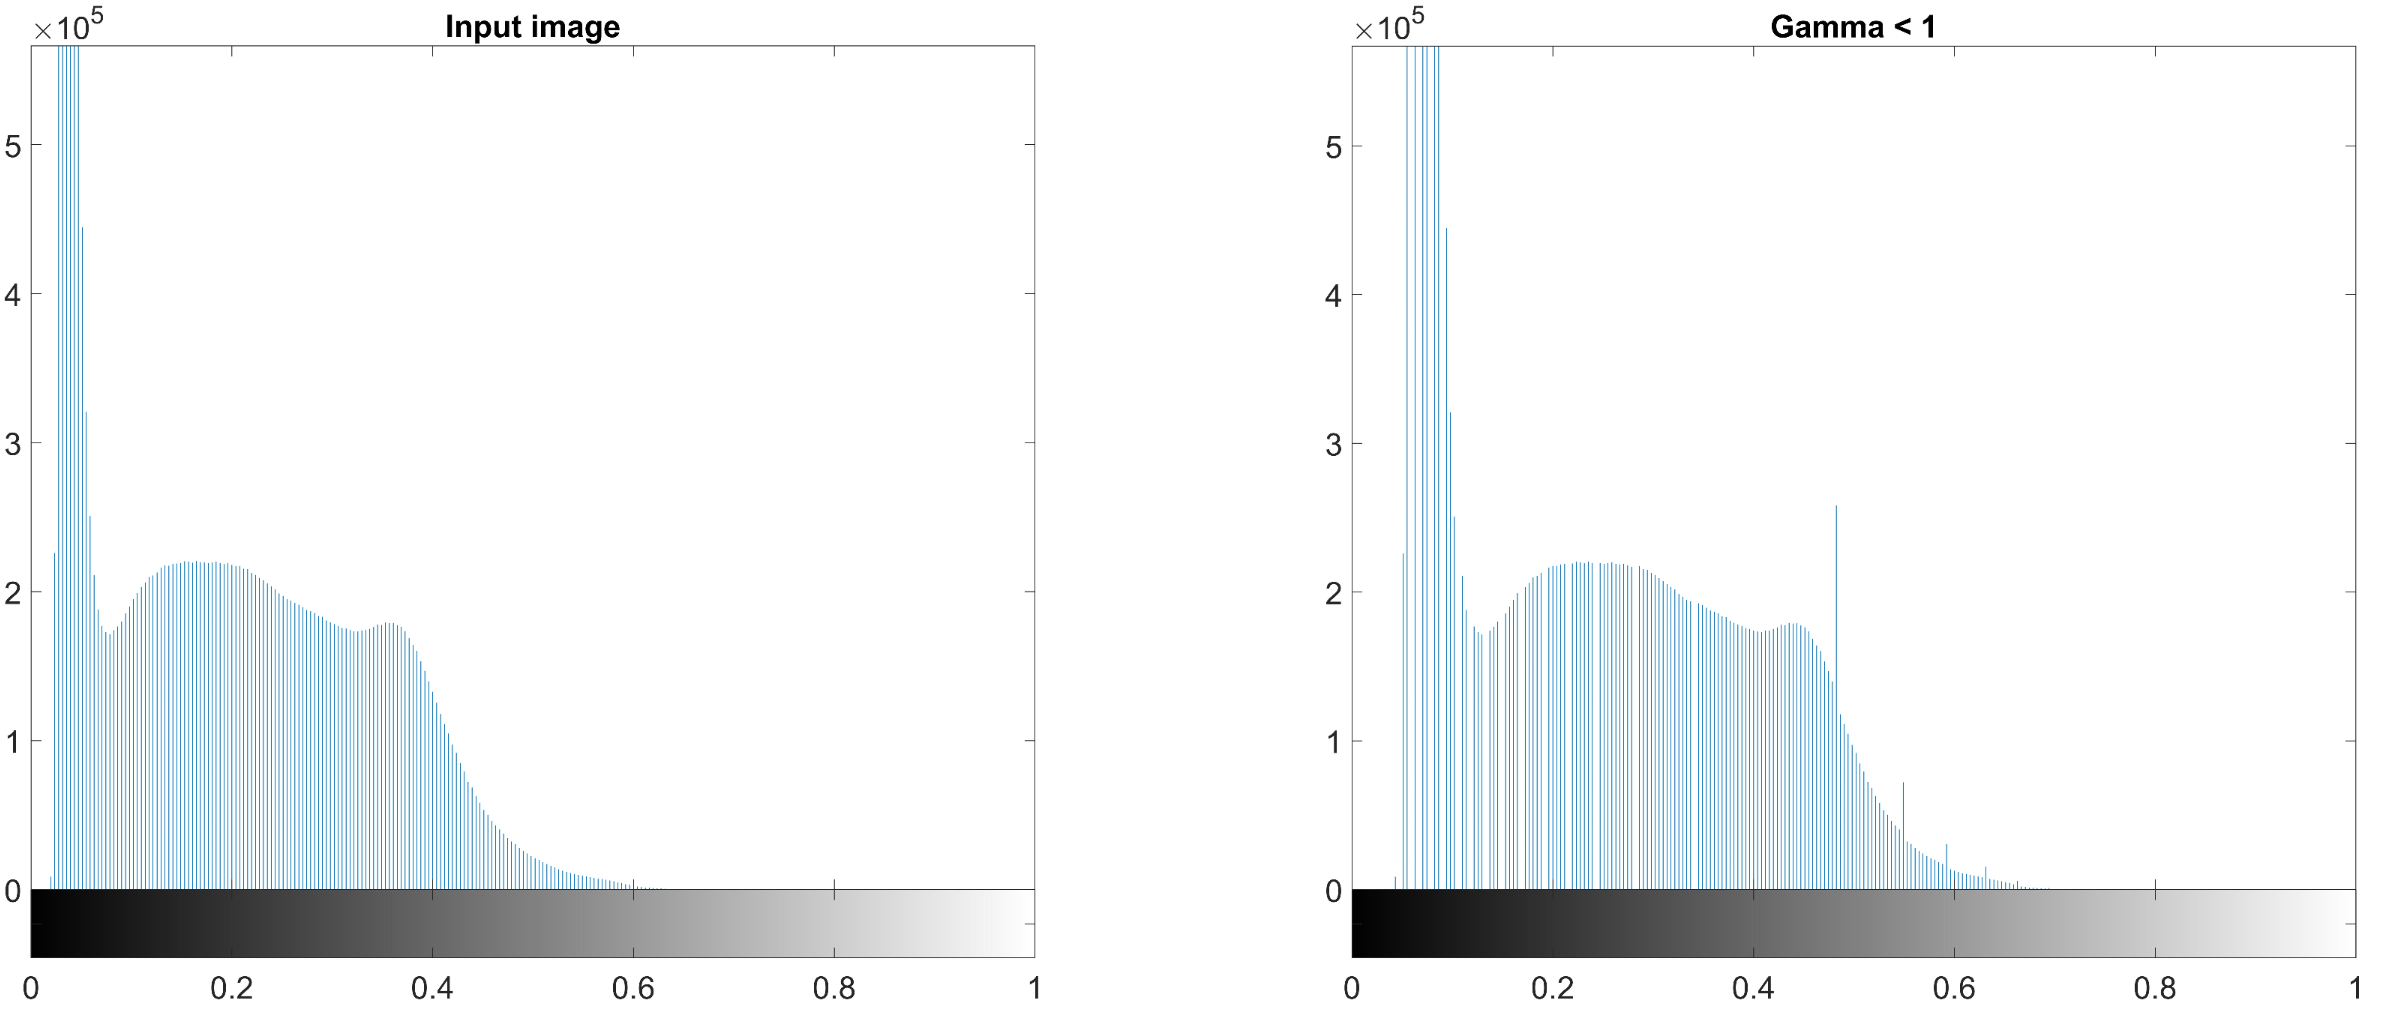
세번째 [low_in, high_in] = [0, 1], [low_out high_out] = [0, 1], gamma = 0.8 의 경우는
낮은 픽셀값 영역(대략 0.3 까지)의 histogram 밀도가 낮다가 우측으로 갈수록 빽빽해을 보입니다.
마지막으로 본 글에 쓰인 모든 MATLAB 코드는 밑에 표시해 두었습니다.
img = imread('NCI-jdfn7Z03Qa4.jpg');
img_gray = rgb2gray(img);               % convert from RGB to grayscale image data
img_gray = im2double(img_gray);         % convert from uint8 to double type data

min_px = min(img_gray(:));
max_px = max(img_gray(:));

% increase brightness by three methods
gamma = 1;
raise_low_out = imadjust(img_gray,[0 1],[min_px+0.2 1],gamma);   % raise 'low_out'
raise_high_out = imadjust(img_gray,[0 max_px],[0 1],gamma);      % raise 'high_out'

gamma = 0.8;
low_gamma = imadjust(img_gray,[0 1],[0 1],gamma);                % low 'gamma'

% plot results
figure; montage({img_gray,raise_low_out})
figure; montage({img_gray,raise_high_out})
figure; montage({img_gray,low_gamma})

% histograms
figure;
subplot(1,2,1); imhist(img_gray); title('\fontsize{20}Input image');
subplot(1,2,2); imhist(raise_low_out); title('\fontsize{20}Raising low out');

figure;
subplot(1,2,1); imhist(img_gray); title('\fontsize{20}Input image');
subplot(1,2,2); imhist(raise_high_out); title('\fontsize{20}Raising high out');

figure;
subplot(1,2,1); imhist(img_gray); title('\fontsize{20}Input image');
subplot(1,2,2); imhist(low_gamma); title('\fontsize{20}Gamma < 1');
출처1: https://www.quora.com/What-is-the-difference-between-brightness-contrast-and-gamma
What is the difference between brightness, contrast, and gamma?
Answer (1 of 4): Not all definitions are the same, but due to tradition from television set controls, this is how they are defined in display technology. Brightness is simply a DC offset. An amount of uniform light added to (or subtracted from) everything
www.quora.com
출처2: https://unsplash.com/photos/jdfn7Z03Qa4
사진 작가: National Cancer Institute, Unsplash
Cells from cervical cancer – Splash에서 National Cancer Institute의 이 사진 다운로드
unsplash.com